 WWW.WA
S.ORG
•
WORLD AQUACULTURE
•
DECEMBER 2014
41
small-scale models mimicking
a simplified aquaculture net pen.
The models were manufactured
using the low-cost, rapid
prototyping capabilities
offered by modern 3D-printing
technology, capable of a spatial
resolution of 20 µm. This
method guarantees precision
and regularity of twines and
mesh, allowing us to modify the
geometry by microns. Thirty
circular pen models, with a
surface porosity varying from
0.56 to 0.90, were manufactured
(Fig. 1). As a point of reference,
typical aquaculture nets have
a porosity of about 0.80. Data
were acquired using dye
visualization, Particle Image
Velocimetry and unidirectional
load cell measurements.
Observations
Despite using a small-scale
model at low inflow velocity,
the observed flow behavior
was in good agreement with
larger-scale experiments and
numerical simulations (Klebert
2013). Varying the net-pen
porosity serves to vary the bleed
flow velocity (Wood 1967),
designated as U
1
, which is the
reduced velocity flow in the
wake of the model as a result
of the flow through the porous
surface at the back side of the
obstruction. Our models are
able to recreate the types of flow
expected in the wake of this
kind of geometry:
•
Regime 1 flows - A laminar steady wake with a bleed flow
velocity (U
1
) that is close to the free flow velocity (U
∞
).
•
Regime 2 flows - A steady wake of finite length that evolves
into an oscillating shear layer and subsequent vortex shedding.
•
Regime 3 flows - The bleed flow velocity is a small fraction
of the free flow velocity, resulting in high velocity gradients and a
shear layer developing into the classic von Kármán vortex shedding
pattern (Williamson 1996).
The mechanism for generation of a particular flow regime is
related to the porosity of the net pen. A very porous pen will have
regime 1 flow (Fig. 2 top) and a nearly solid pen will generate a
regime 3 flow (Fig. 2 bottom). However, porosity is not the only
parameter determining the wake, as two net-pen models of identical
porosity but different twine/mesh ratio can produce different flow
dynamics and significantly different drag.
Environmental
Aspects
The netting density
of a pen, usually imposed
by the need to retain fish
of a specified size, plays an
important role in the operation
of a net pen. It dictates the
oxygen supply rate to the
pen from inflowing water
and the rate that wastes are
flushed through the pen. The
dispersion of biosolids is
directly related to the flow
regime and the magnitude
of the bleeding flow. Net-
pen models with the first
flow regime have the fastest
diffusion time, whereas
models with the third flow
regime tend to trap particles
in their wake for an extended
period. To consider the issue
of waste, this may have an
impact on fish health, as in
the case of waste returning to
a net pen with a turning tide,
which is not preferable.
Impact on Drag
We conducted multiple
experiments, each varying
only one parameter: twine
thickness, the mesh void or
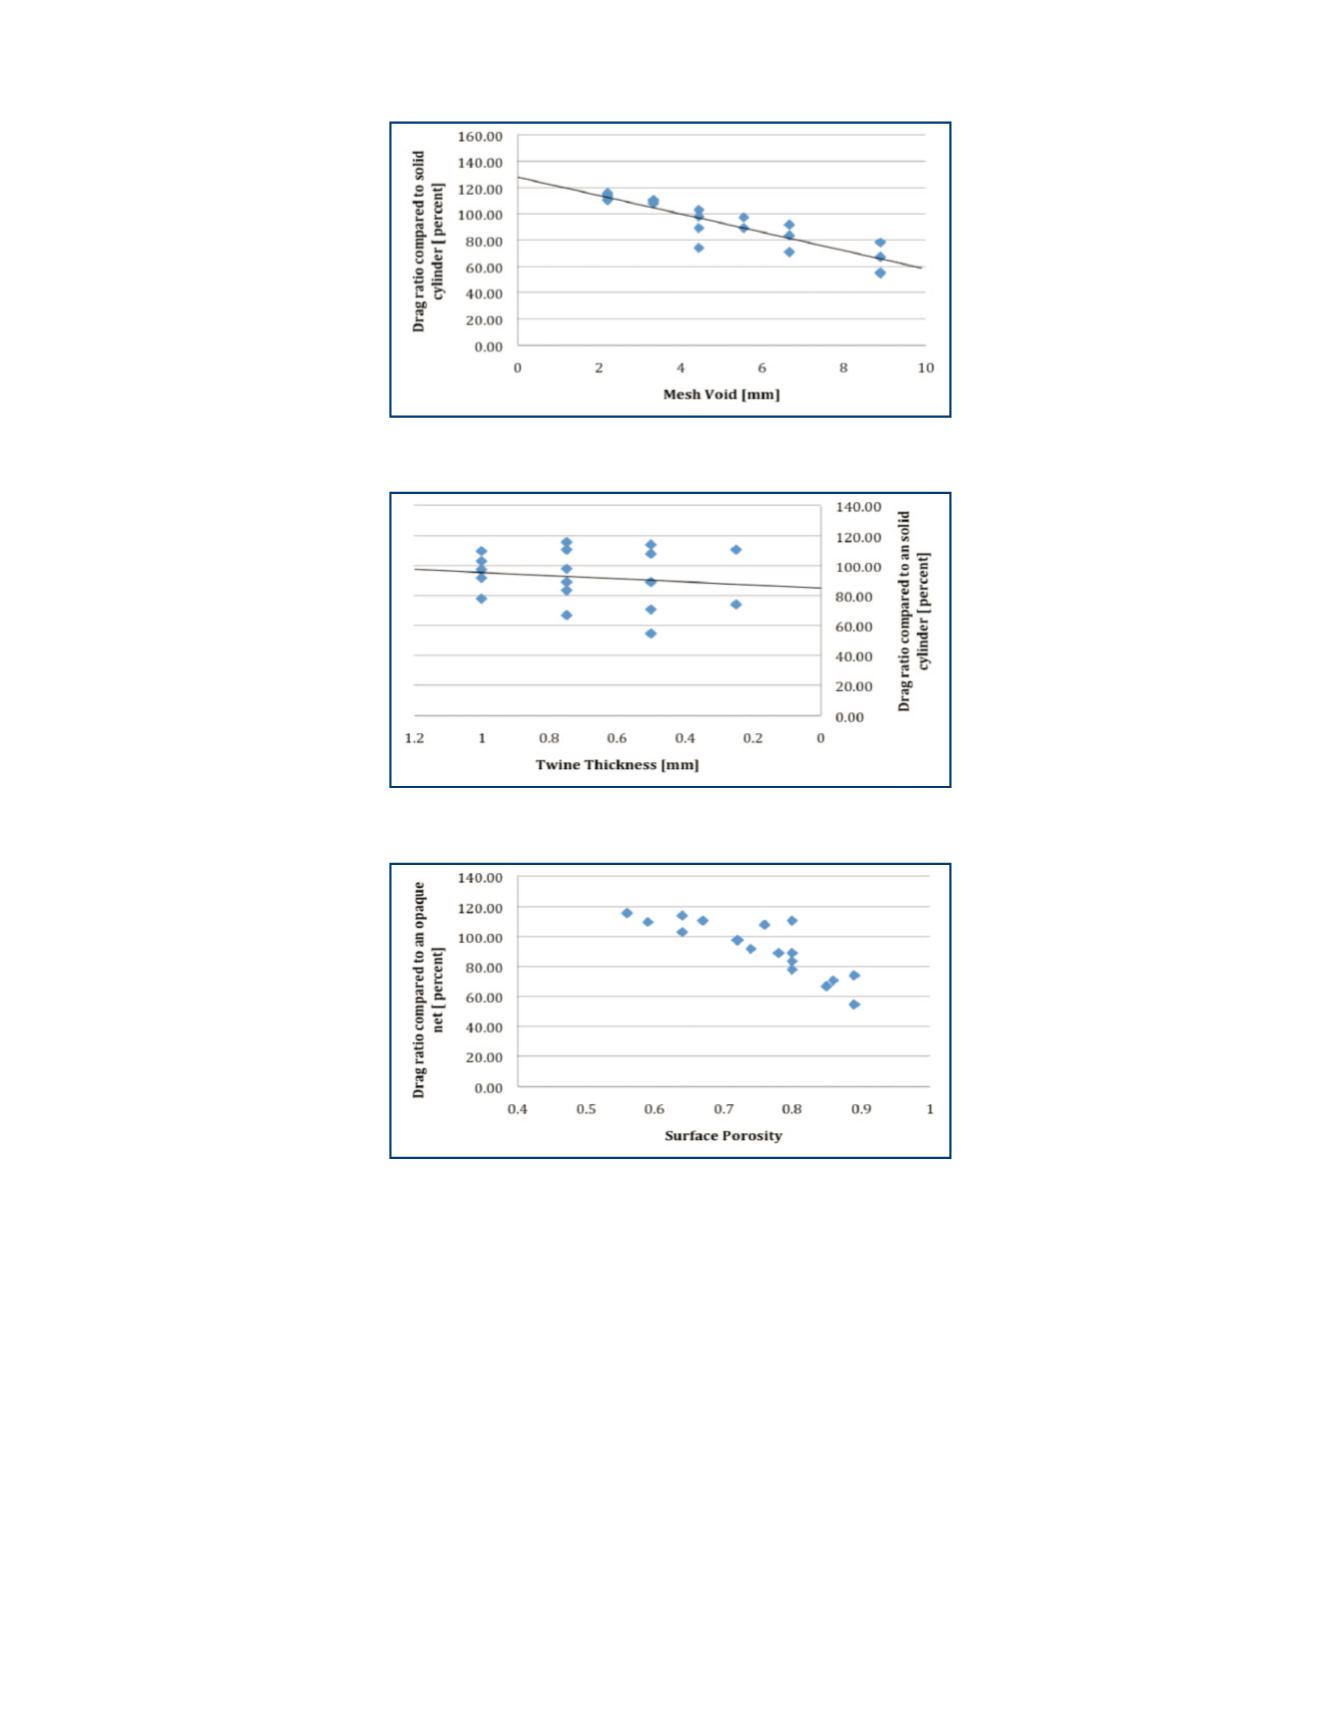
porosity. The results indicate
the following trends:
•
An increase in the
mesh void tends to result in a
reduction of drag. However, a
void that is too small induces
more drag than a completely
opaque net (Fig. 3).
•
A reduction of twine thickness does not necessarily lead to a
reduction of drag. Regardless of twine thickness, it is always possible
to identify a net-pen model porosity with a greater drag than an
opaque net (Fig. 4).
•
An increase in net porosity does not necessarily induce less
drag. The same drag was obtained with models of surface porosity
varying by over 40 percent (Fig. 5).
Based on these results, we infer that the induced drag on a
net pen produced by the net cannot be determined by the surface
porosity parameter alone. Although mesh void is the dominant
parameter driving the mechanism, generating drag, the effect of
twine thickness cannot be overlooked.
We are currently revising the mathematical model which,
if verified on a larger-scale aquaculture net-pen model, could
( C O N T I N U E D O N P A G E 4 2 )
FIGURE 5.
Drag of various net models as a function of the surface porosity E.
FIGURE 4.
Drag of various net models as a function of the twine thickness.
FIGURE 3.
Drag of various net models as a function of the mesh void.


