
44
DECEMBER 2014
•
WORLD AQUACULTURE
•
WWW.WA S.ORGR
equirements for
pond aquaculture include
land for pond construction,
soil with suitable properties
for constructing stable
embankments, sufficient water
availability and an enabling
socioeconomic environment
(Giap
et al
. 2005). Data reported
by national aquaculture
agencies to the FAO Fisheries
and Aquaculture Department
for compiling country-level
aquaculture production
statistics
1
are based on pond
water surface area. However,
additional land on farms is
necessary to support the pond
culture system, including
embankments, canals, roads,
storage areas, buildings and
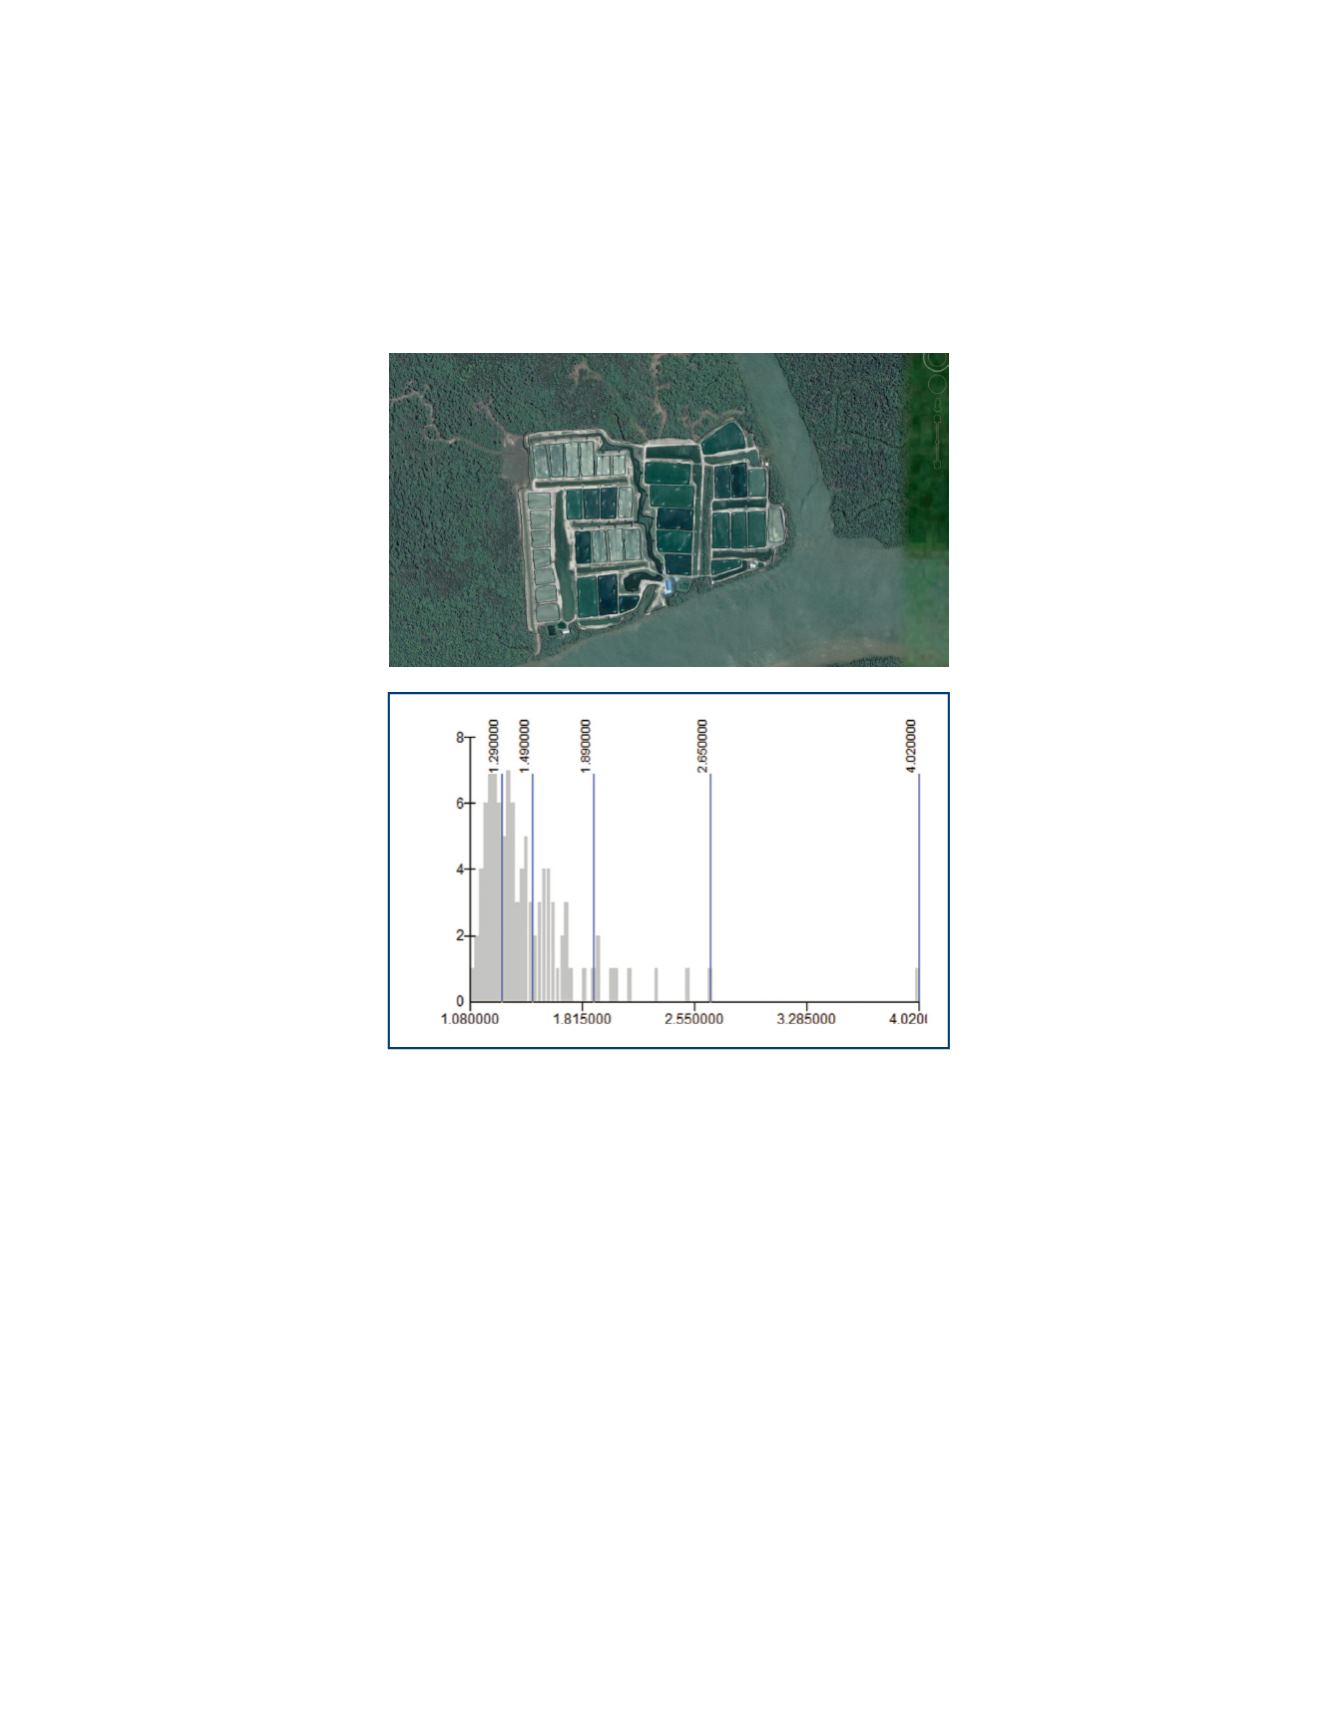
parking lots, as illustrated in
the image of a farm in Figure 1.
This land is needed for farms to
operate and usually cannot be
used for other purposes.
Since the middle of the
20th century, aquaculture
production has increased
sharply in response to
increasing demand for
foodfish. Farmers reacted by
establishing more farms and
by intensifying production on
existing farms to meet this
demand. This phenomenon is
continuing in the 21st century.
Intensifying a system requires
a greater stocking density; use
of feeds, antibiotics, pesticides
and disinfectants; and a
greater amount of mechanical
aeration (Sapkota
et al
. 2008). On intensive farms, ponds tend to
be smaller than on extensive and semi-intensive farms, and this
means a relatively greater area for roads and canals on intensive
farms. The intensity of pond aquaculture has been increasing as
better management practices were developed and implemented. For
example, channel catfish production in the southern USA averaged
Land to Water Surface Area Ratio
in Pond Aquaculture
Lauren N. Jescovitch, Philip Chaney and Claude E. Boyd
less than 2 t/ha in the late
1960s, but is over 5 t/ha today
(Boyd
et al
. 2013).
Measuring the Area
of Aquaculture Ponds
Based on 2005 data,
there were about 11.1
million ha of water surface
area of ponds in the world,
including freshwater and
saltwater areas (Verdegem
and Bosma 2009). This
number possibly has increased
to around 16.7 million ha,
based on 2011 aquaculture
production data from FAO,
assuming no increase in
production intensity during the
intervening 6 years. This area
is very likely an underestimate
of the total amount of land
dedicated to aquaculture use.
The most accurate way
of measuring water and land
areas is with conventional
surveying and mapping
techniques (Boyd and Shelton
1984). This technique requires
surveying instruments and
knowledge of their use and
is time-consuming and
tedious. Considering the
alternatives, estimation of areas
using satellite imagery was
considered appropriate for the
objectives of this study.
Remote sensing and
GIS allow the acquisition of a
series of synoptic data for large
geographic areas, uniformly in
space and time, and without the
need for exhaustive field surveys (Green
et al
. 1996). This permits
prediction of impacts to the local environment of food production
around the globe. Aquaculture competes for resources with other
economic activities, and should be evaluated for the sustainability of
land management (Alonso-Perez
et al
. 2003). The satellite imaging
approach requires current and accurate thematic information to
TOP, FIGURE 1.
A typical farm, located in Malaysia, that was evaluated in this
study. Screenshot by Lauren Jescovitch.
BOTTOM, FIGURE 2.
Natural breaks
in the distribution of land to water surface area ratios were determined from a
sample of 100 farms by Jenks Optimization.
The average ratio of total land area to pond
water surface area was 1.48, with a range
of 1.08 to 4.02. Most farms had land to water
ratios less than 1.89. As average pond size
increased, the ratio decreased, stabilizing at
about 1.25 beyond a pond water surface area
of 3 ha. A ratio <1.29 can be recommended as a
standard for improved land use efficiency
in pond aquaculture.


