ASSESSMENT OF BENTHIC IMPACTS OF SALMON FARM ACTIVITIES ON A DEEP SITE IN NEWFOUNDLAND
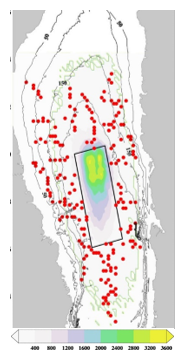
Assessing the changes in benthic organic loading due to particle wastes is challenging in environments such as in NL with deep sites dominated by hard substrates. Here, we analyzed video surveys and generated outputs of a waste deposition model using oceanographic and feeding rate data provided by industry in one NL site. Changes, at different time points during production (over 15 months) in the density of epifauna including habitat building species such as corals and sponges were evaluated. The area was classified in different habitats based on depth, substrate type and taxa clustering using baseline information (Table below- Habitats characterization following multivariate analyses of baseline videos using PERMANOVA+). Still images from drop camera taken during three surveys were also analyzed to identify taxa present at different times (4, 9, 14 months of production). Changes in benthic communities were found to be correlated to distance from cage array and cumulative deposition calculated using DEPOMOD model (V 2.2) with extrapolated 1.5-month ocean current measurement and real time feeding rates. Modelled solid and carbon deposition decreases away from the site as expected (Figure: Map of cumulative carbon deposition (g C/m2) after 15 months of production. Red dots represent locations of video surveys). The analysis shows a decrease in abundances and richness up to a distance of 270 m away from the cages which corresponds to a modelled solid deposition with an upper value of 190 g C/m2. In habitats dominated by Ball like sponges or seapen, PERMANOVA revealed an effect of deposition, distance to cage and time of sampling with decreasing abundances 270 m from net pens. No performance-based indicators (Bacterial mats, Polychaetes) were observed during the surveys.

